Capabilities
What BUSROOT does
Eight capabilities that find and fix what's costing you output, and the tools your team uses to connect machines, run the shift and find the pattern.
Asset Utilisation
Is each asset working?
See how much of the time each asset is productive and when it sits idle, so you can find hidden capacity.
Learn more
Downtime
Why did we stop?
Detect stops automatically, capture the reason from the operator, and see what each stop cost.
Learn more
Production Tracking
How much have we made?
Count every unit as it is made and compare output with the target, live and shift by shift.
Learn more
OEE
How close are we to full potential?
Overall Equipment Effectiveness, calculated automatically and split into availability, performance and quality.
Learn more
Quality
What did we reject, and why?
Record rejected units against a reason, so you can break bad production down by cause and cost.
Learn more
Energy Efficiency
What does each unit cost in energy?
Measure the energy each station and each unit uses, and the energy wasted when nothing is scheduled.
Learn more
Scheduling
Are we running to plan?
Plan production and maintenance for each station, send jobs to the floor, and compare what ran with the plan.
Learn more
Tasks
Were the checks done?
Turn paper checklists and SOPs into Tasks that operators complete at the station, with a full audit trail.
Learn more
The tools
Every capability runs on the same tools, grouped by what they do: connect your shop floor, control the shift, and optimise what happens next. Developers can connect your own systems too.
Connect
Connect the shop floor
BUSROOT connects to any machine, whatever its make, model or age. See how
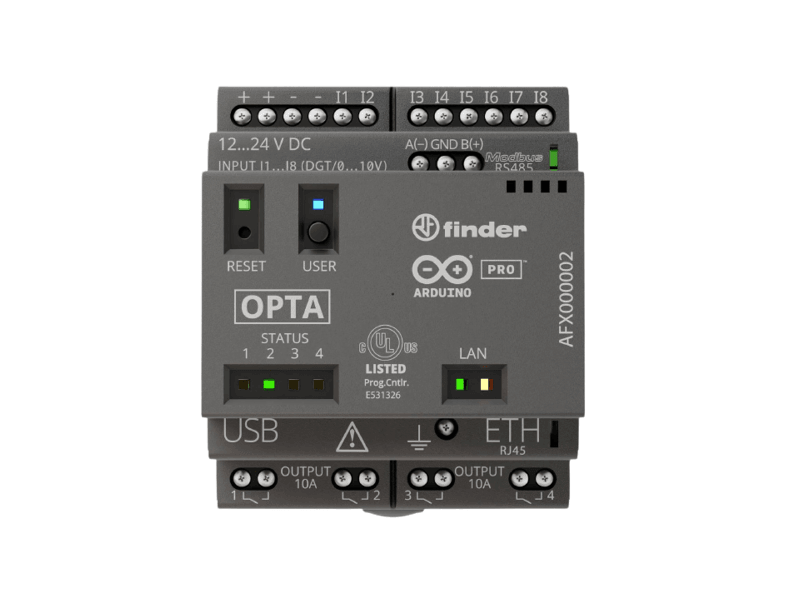
Machine connectors
Micro PLCs and sensors that connect any machine, old or new, whether or not it has its own PLC.
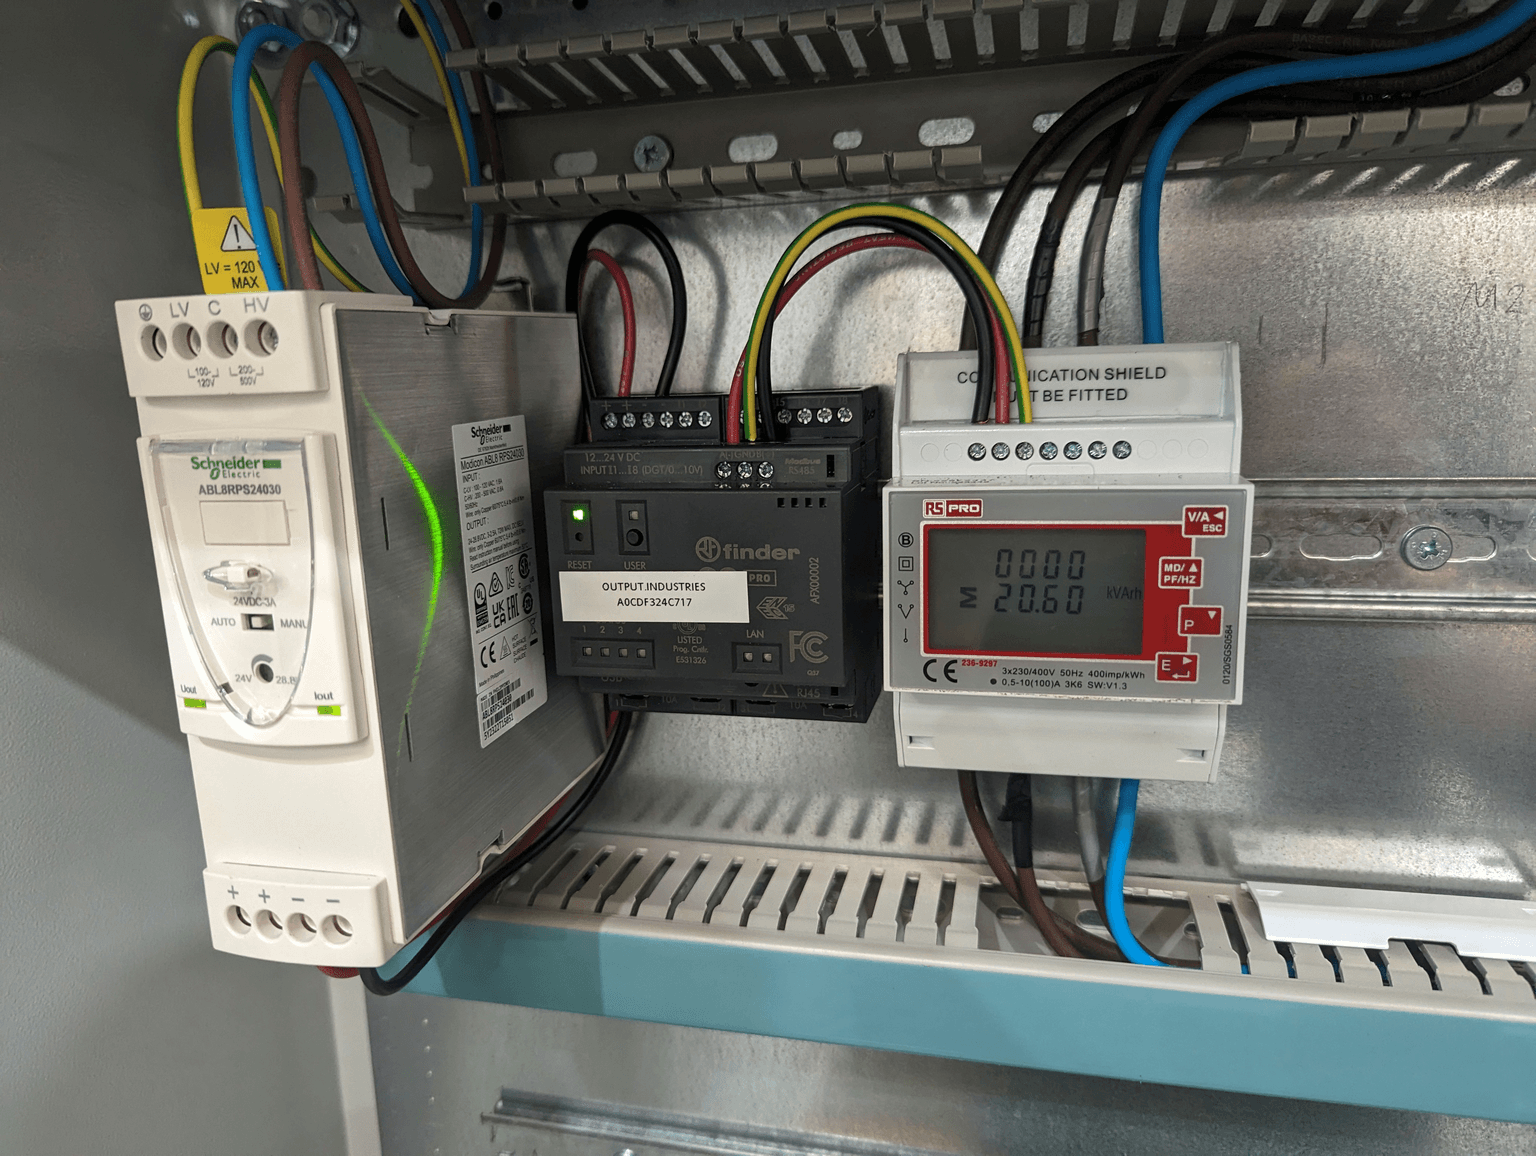
Energy meters
Meters for single-phase and three-phase supplies, measuring energy at each machine.
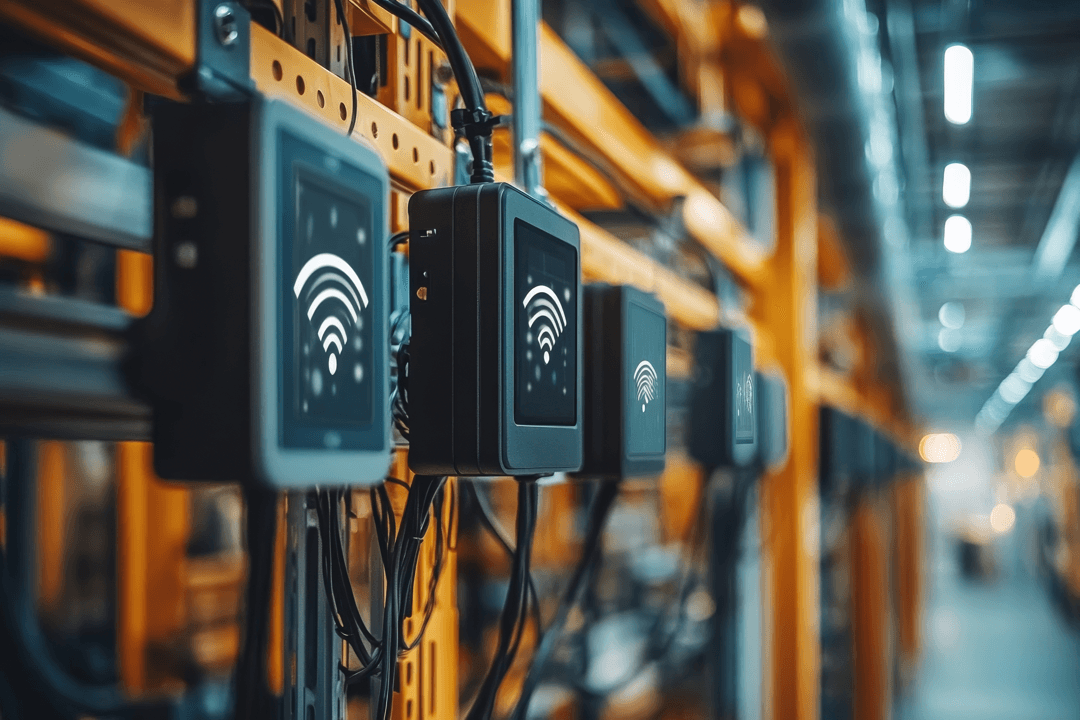
Shop floor network
Devices connect over your own Wi-Fi, or over a dedicated wireless network with 4G gateway routers that needs no connection to your IT network.
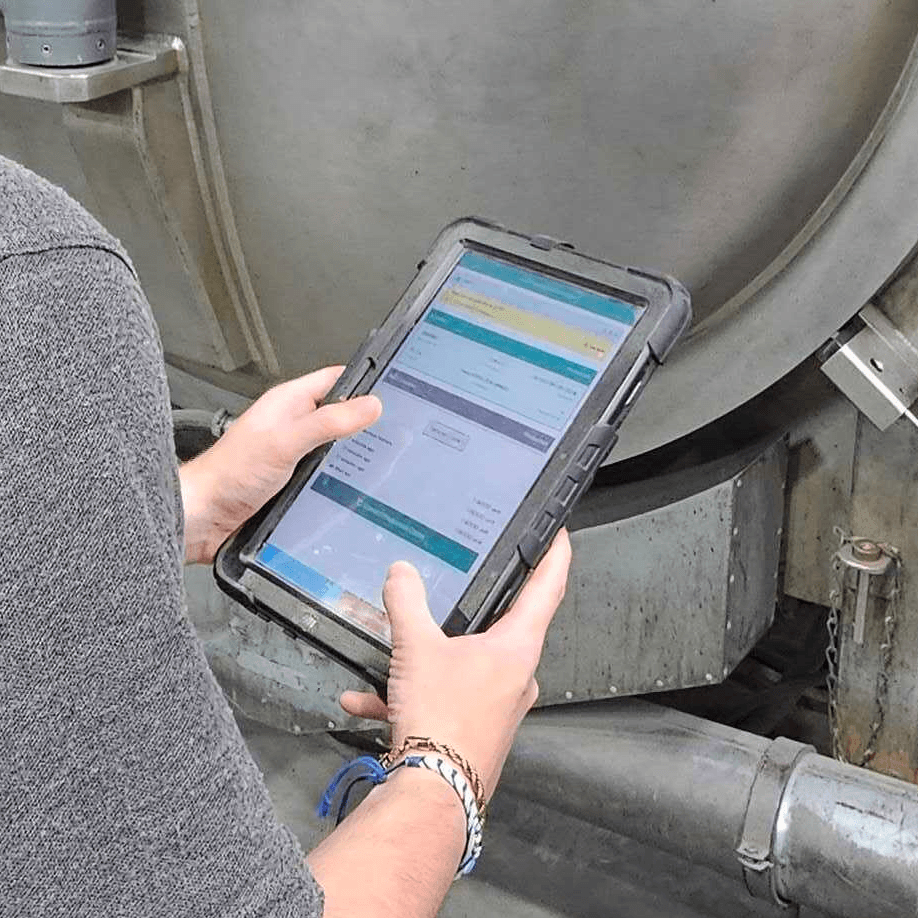
Operator screens and displays
Any device with a modern web browser, such as a touchscreen, tablet, PC or TV, running the Operator Interface or Production Progress.
MQTT
The station signals that machine connectors and other devices send to BUSROOT.
Control
Run the shift
Cockpit
The live dashboard. Shows each station's status, schedule progress, the last hour's production and OEE.
Production Progress
A large-screen board showing each running schedule's quantity against target and its estimated finish time.
Operator Interface
The operator's screen at the station, in any modern web browser. Operators give downtime reasons, start schedules, count and correct production, and complete Tasks.

Alerts and daily summary
An email when a station stops, and a daily downtime summary at 07:00.
Gantt and schedules
Create, upload, order and prioritise production and non-production schedules.
Optimise
Find the pattern
Pulse Chart
A coloured block for each time window and station, for spotting patterns within a shift.
Trend Viewer
Plots any of 15 metrics over time for up to 5 stations.
Hierarchy Explorer
One table of time, production, stop and energy figures, rolled up from station to plant.
OEE Analysis
OEE split into availability, performance and quality, with the cost of lost production.
Interval Chart
Production against target by the hour or half hour, for short interval control.
Downtime list and analysis
Every stoppage with its reason, and a breakdown of downtime by reason.
Production reports
Weekly Report, by Station, by WO Ref., by SKU, and a list of production entries.
Developers
Integrate with your systems

API and SDK
Full API coverage for inputs and outputs, and the busroot-sdk package for JavaScript and TypeScript.
Power BI and Grafana
Direct access to the data warehouse from your own BI tools.
CSV export
Backups and bulk data export as CSV downloads.
Get the latest insights on data-driven manufacturing.
Join our mailing list for updates, tips, and exclusive tools!