
Overall Equipment Effectiveness is a key metric used within the manufacturing industry to assess how well machines are performing. It combines multiple performance indicators into one unified score, providing a clear and quantifiable measure of manufacturing efficiency. By measuring OEE, manufacturers can identify areas of waste, streamline processes, and improve production outcomes.
However, despite the high awareness of this metric within the industry, there is a lot of confusion over how to actually calculate OEE. In this blog, we will be giving you all the tools and information to be able to successfully calculate OEE within your manufacturing business. We'll also be giving away how you can implement our manufacturing analytics platform, Busroot, completely free of cost!
How is OEE calculated?
OEE is calculated using 3 key performance elements:
Availability x Performance x Quality
Each factor is given a score out of 100 and are combined to give an overall score out of 100. For example:
Availability 95% x Performance 85% x Quality 70% = 0.95 x 0.85 x 0.70 x 100 = 57%
From this you can see the impact that the poor quality score has on your overall score, so it's a good way to identify where the pitfalls in your performance are.
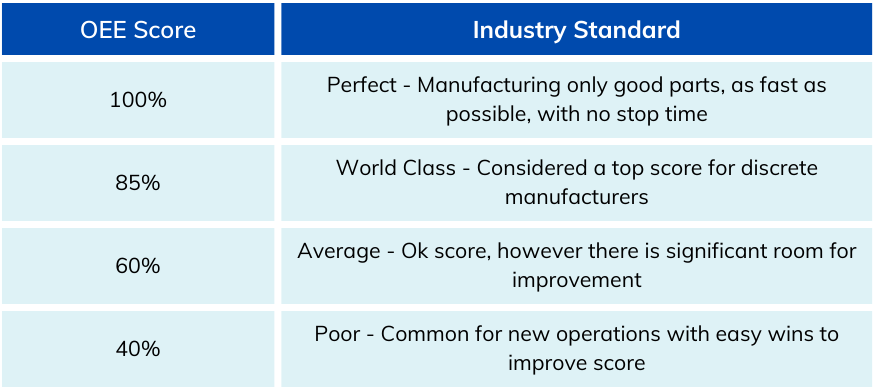
What does an OEE score mean?
A score of 100% is essentially perfection! It means that your machines are running 24/7, at peak speed and only producing good (non-defected) products. A score of 100% is the gold standard for manufacturing, but it is actually much more rare than you would think. Machines naturally experience wear and tear, mechanical breakdowns etc, and no business is immune to staffing or supply issues. As such, it's natural that facilities aren't going to operate at peak performance 24/7.
Generally, a score of 80%-100% is seen as a great score.
Now, let's dive deeper into how to calculate each of these performance elements!
Calculating Availability
Availability measures the total amount of time that your equipment was in operation, versus the greatest amount of time that it could be in operation.
The main factors that impact availability are planned and unplanned stops.
Planned stops are when a pre scheduled activity has caused a period of time in which machines are not operating. These activities usually involve staff changeovers, material top ups, quality inspections, or routine maintenance.
Unplanned stops are (as you can probably guess!) any significant period of time in which machines are not operating, that is due to something which has not been pre planned. This is usually caused by machine breakdowns, material shortages or unplanned staffing issues.
As such, the way in which we calculate availability is:
Availability = Actual Operating Time / Planned Production Time
Actual Operating Time is the total amount of time that your machines were running, taking into account any downtime. Planned Production Time is the total amount of time that your machines could have been running, if there were no planned or unplanned downtime.
For example:
You have an 8 hour shift in which machines are due to run the entire time. You experience 30 minutes for a routine maintenance inspection (planned stop), and 2 periods of 20 minutes where a machine broke down and needed to be fixed (unplanned stop). Therefore:
Planned Production Time = 8 hours / 480 minutes
Actual operating time = 480 - 30 - 40 = 410
Availability = 410 / 480 = 0.85 x 100 = 85%
This highlights that even with a few unexpected break downs per day, you can still achieve a really great availability score!
How can I improve availability?
Some of the key ways in which you can improve availability include:
- Preventive Maintenance: By implementing a robust preventive maintenance program with regular equipment servicing, you will help to prevent breakdowns and unplanned stoppages. This approach involves scheduled maintenance activities based on time or usage triggers.
- Predictive Maintenance: Utilise predictive maintenance techniques. By monitoring the condition of equipment using sensors and data analytics, you can predict and address potential failures before they occur, thereby reducing unexpected downtime.
- Rapid Response and Repair: Develop a system for quick response to equipment failures. This involves having a skilled maintenance team ready and spare parts available to reduce the time taken to fix breakdowns.
- Operator Training: Proper operation of machinery reduces the risk of breakdowns caused by operator errors. Regular training and refresher courses can keep skills sharp and reduce errors. Similarly, train your staff to be able to identify early signs of machine failure. This way you can address the issue before it causes any downtime.
- Technology Upgrades and Automation: Consider investing in newer, more reliable machinery or automation where feasible. Advanced equipment with better technology can have higher reliability and easier maintenance.
Calculating Performance
The next metric within our equation is performance. Performance is related to how quickly a product was created in comparison to the top speed at which this can be achieved. This is known in the industry as "cycle time".
Performance is mostly reduced by small stops and slow cycles. Small stops are similar to unplanned stops, so your organisation will need to set thresholds to be able to establish between loss in availability vs performance. For example, a small stop might be anything 5 minutes or less, and an unplanned stop is anything above 5 minutes. Small stops are generally caused by material bottlenecks, quick inspections, or cleaning activities.
Slow cycles refers to an overall reduction in the speed of a cycle that isn't caused by any particular adverse event. Slow cycles can be caused by a number of issues including machine wear and tear, slow signalling, improper machine calibration, operator error etc.
As such, performance is calculated by:
Performance = (Ideal Cycle Time x Total Count) / Run Time
Ideal Cycle Time is the fastest speed at which you can product one unit, and total count is the amount of units you can produce in one shift. Run time is the actual time it took to produce the total number of units.
For example:
It takes your machine 30 seconds to produce one unit (ideal cycle time). The machine produced 500 units this shift (total count), and had a total run time of 300 minutes. Therefore:
Performance = (0.5 x 500) / 300 = 0.83 x 100 = 83%
How can I improve performance?
Some of the key ways in which you can improve performance are:
- Regular Inspections and Maintenance: A big factor that contributes to slow cycle times and minor stoppages is machines not properly functioning due to old or broken parts. Ensuring you have a regular inspection and maintenance schedule in place ensures that you can fix any wear and tear or damage before it starts impacting performance.
- Implement a proper cleaning schedule: Another factor that can impact cycle time is build up of dirt and grease that prevents machines from working optimally. By implementing a proper cleaning schedule, you will ensure that this does not occur and the machines are working at their optimal speed.
- Improve Workflow and Process Efficiency: Streamline your production processes by identifying bottlenecks in production. There may be certain areas of production that consistently cause issues, so using techniques like value stream mapping can help to identify and eliminate bottlenecks in the workflow.
- Enhance Operator Training and Skills: Well-trained operators are more likely to run equipment efficiently and effectively. Regular training and skill development can help operators optimise machine performance.
- Utilise Technology and Automation: If machines are consistently causing issues, or there are manual tasks that could be automated, then investing in advanced technology like our manufacturing analytics platform Busroot, or automating certain processes will help to enhance performance.

Calculating Quality
The third and final element in our equation is quality. Quality is pretty self explanatory and is related to the standard of the product. Is the unit fit for selling, or are there defects that mean it cannot be sold? This includes units that need to reworked in order to fit quality standards. Ultimately you can have the quickest and most efficient processes, but if the output is not up to standard then you will be sinking money down the drain.
Quality is affected by start up rejects and production rejects. Start up rejects are any units that are defected during the warming up period, which is when machines are turned on or are changed operators. Factors causing start up rejects generally include inefficient changeovers and misconfiguration of systems.
Production rejects are any units that are defected after the warming up period. Factors causing production rejects are generally operator error or lack of materials.
As such, quality is calculated by:
Quality = Good Unit Count / Total Unit Count
Good unit count is the total number of products that were up to standards and fit for selling, and total unit count is the total number of units produced, including any that aren't fit for selling.
For example:
During a shift, you produced 800 total units, and 157 of these were not fit for selling. Therefore:
Quality = 643 / 800 = 0.8 x 100 = 80%
How can I improve quality?
Some of the key ways in which you can improve quality are:
- Standardise changeover procedures: Standardising changeover procedures ensures that all of your staff are carrying out the same actions. This way you reduce the number of unexpected issues that arise during changeovers. Consistent processes lead to consistent quality.
- Training: Again, training is key to ensuring that your employees know how to properly operate the equipment, and this will lead to less human errors.
- Implement consistent quality checks: Implementing quality checks at various points across the production line will ensure you are catching any quality issues early on. This way you can fix the issue before it creates a bigger impact.
- Invest in higher quality materials: If you have implemented all the correct procedures and are still experiencing issues, it may be time to invest in higher quality materials that will work better within your machinery. The increased costs will likely be balanced out by the reduction in waste.
Benefits of monitoring OEE
As we've highlighted across this blog, monitoring OEE is essential for highlighting areas in your production that need improvement. If offers a deeper insight into where you can increase efficiency, and can significantly improve business profits. Some of the benefits of monitoring OEE include:
- Increased Productivity: Companies that have implemented and closely monitored OEE have reported significant improvements in productivity. It's not uncommon to see reports of productivity increases in the range of 10-30% following the implementation of OEE monitoring and optimisation strategies.
- Reduction in Downtime: Downtime reduction is another key benefit. Businesses that focus on improving the 'Availability' component of OEE often see a notable decrease in equipment downtime. Companies frequently experience reductions in downtime of 15-50%, depending on the initial state of the equipment and processes.
- Improved Quality Rates: The focus on the 'Quality' aspect of OEE can lead to a marked improvement in the quality rate. For some businesses, this could mean reducing the defect rate by several percentage points, which directly translates to cost savings and higher customer satisfaction.
- Cost Savings: By optimising manufacturing processes through OEE, companies can achieve substantial cost savings. This is often a result of reduced waste, lower energy consumption, and more efficient use of raw materials.
- Return on Investment (ROI): When it comes to ROI, companies that invest in OEE improvement programs often see a positive return. The payback period can vary, but many businesses report recovering their investment within a year or two, thanks to the savings and efficiency gains.
- Enhanced Competitive Edge: Beyond direct financial metrics, businesses that effectively monitor and improve their OEE tend to gain a competitive edge in the market. This might not always be quantifiable in immediate financial terms, but it contributes to long-term market positioning and growth.
However, it's hard to understand the benefits without seeing the numbers.
Say production at 100% is worth £1,000,000 per year in revenue. This means an improvement in OEE from 70% to 75% will increase revenue by £50,000!
Is there a way of automating OEE calculations?
One of the best ways in which you can automate OEE calculations and monitoring is by using a data analytics platform. Here at Output Industries, we have developed a best in class manufacturing analytics platform called Busroot. Busroot connects to your machinery using IoT devices and is able to track a whole host of metrics, including:
- OEE
- Cycle Time
- Downtime
- Production Efficiency
- Asset Utilisation
At any given time, Busroot is able to tell you whether a machine is in operation. If the machine is not running, it can tell you exactly why. One of the places where manufacturers struggle is identifying the cause of downtime. Knowing exactly where an issue arose can be tricky, as there are so many components and moving parts. This therefore leaves big gaps in knowledge, and lots of potential for production loss.
With Busroot, you can customise your workflows so that the second a machine goes down, it will send an alert to the right person, detailing what happened and how to fix it. This means you can get your machines up and running in a matter of minutes, saving valuable time and money. It can also set up preventative maintenance schedules based on past performance data, which can significantly improve your OEE score.
What's even better, is that with funding from MakeUK, we are currently offering 25 companies the chance to implement Busroot for FREE! Our Lighthouse Project will give you the chance to experience the power of Busroot for 5 of your machines, without having to spend a penny. Click here for more information and register your interest for this amazing opportunity.
The ROI of Improving OEE with Busroot
The gains you can achieve from Busroot immediately make the investment worthwhile. On our standard tier of 10 machines at £150 per month, you will pay only £18,000 per year.
Using our example from earlier, a 5% increase in OEE could increase revenue by £50,000. This means that by investing in Busroot, you can get your money back within 1 year AND increase your revenue by £32,000!
And 5% is the bare minimum OEE improvement that we've seen from companies utilising Busroot. Most companies are able to increase their OEE by 10-15%.
So, want to find out more about how Busroot can support your business? Schedule a demo with us and one of our experts will show you the power of Busroot!


